MRP glossary TOP > P > P Chart
P Chart
P Chart
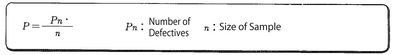
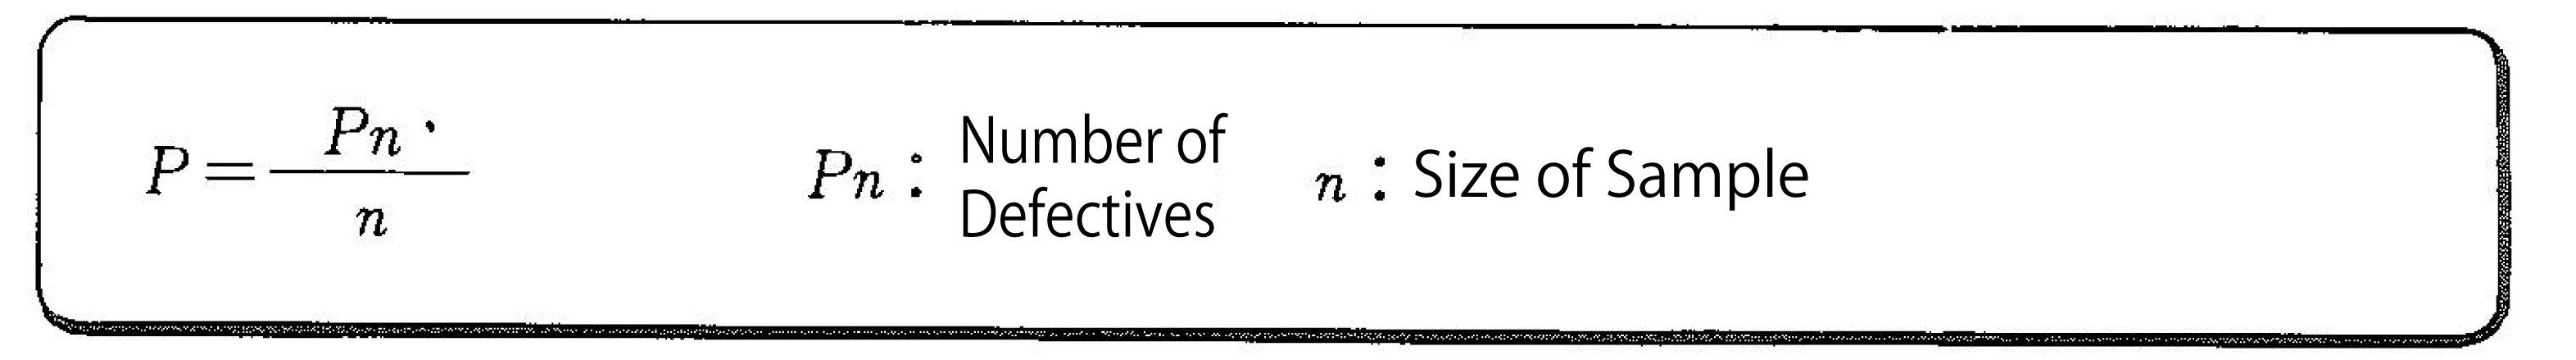
P chart, which is also called Failure Rate Chart, is used for controlling Failure Rate P. It creates 20 to 25 inspection lots (R) and selects 1 to 5 samples (n) from each lot, and then calculates the Failure Rate.
 Next, it calculates control limit line,
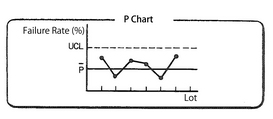
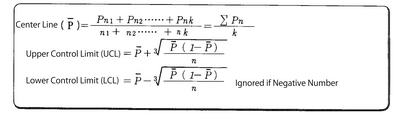 and draws P chart like the chart using P of each lot and the control limit line. At the result, when all Ps are within the control limit line, it means the manufacturing process is maintain in the state of statistical control, while when any P is out of the control limit line, it examines the cause(s) and takes measures.
Related term: Control Chart
P chart, which is also called Failure Rate Chart, is used for controlling Failure Rate P. It creates 20 to 25 inspection lots (R) and selects 1 to 5 samples (n) from each lot, and then calculates the Failure Rate.
 Next, it calculates control limit line,
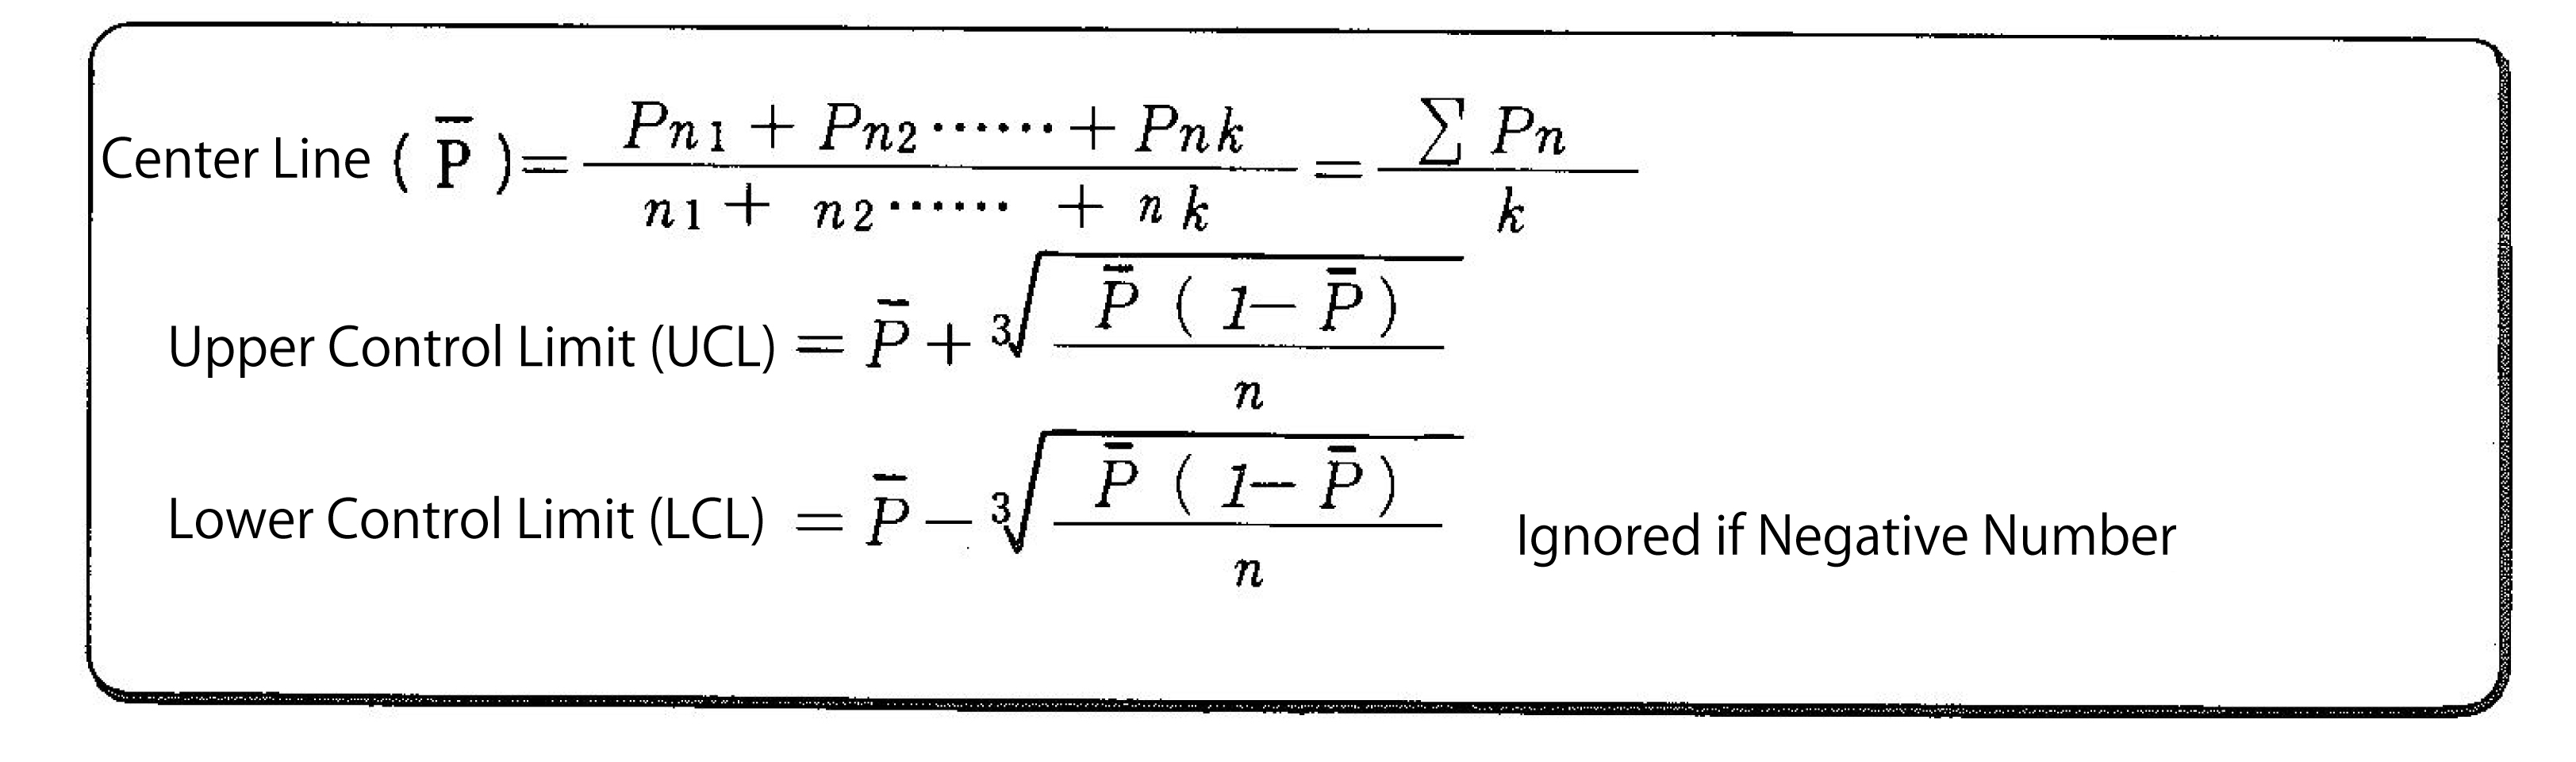 and draws P chart like the chart using P of each lot and the control limit line. At the result, when all Ps are within the control limit line, it means the manufacturing process is maintain in the state of statistical control, while when any P is out of the control limit line, it examines the cause(s) and takes measures.
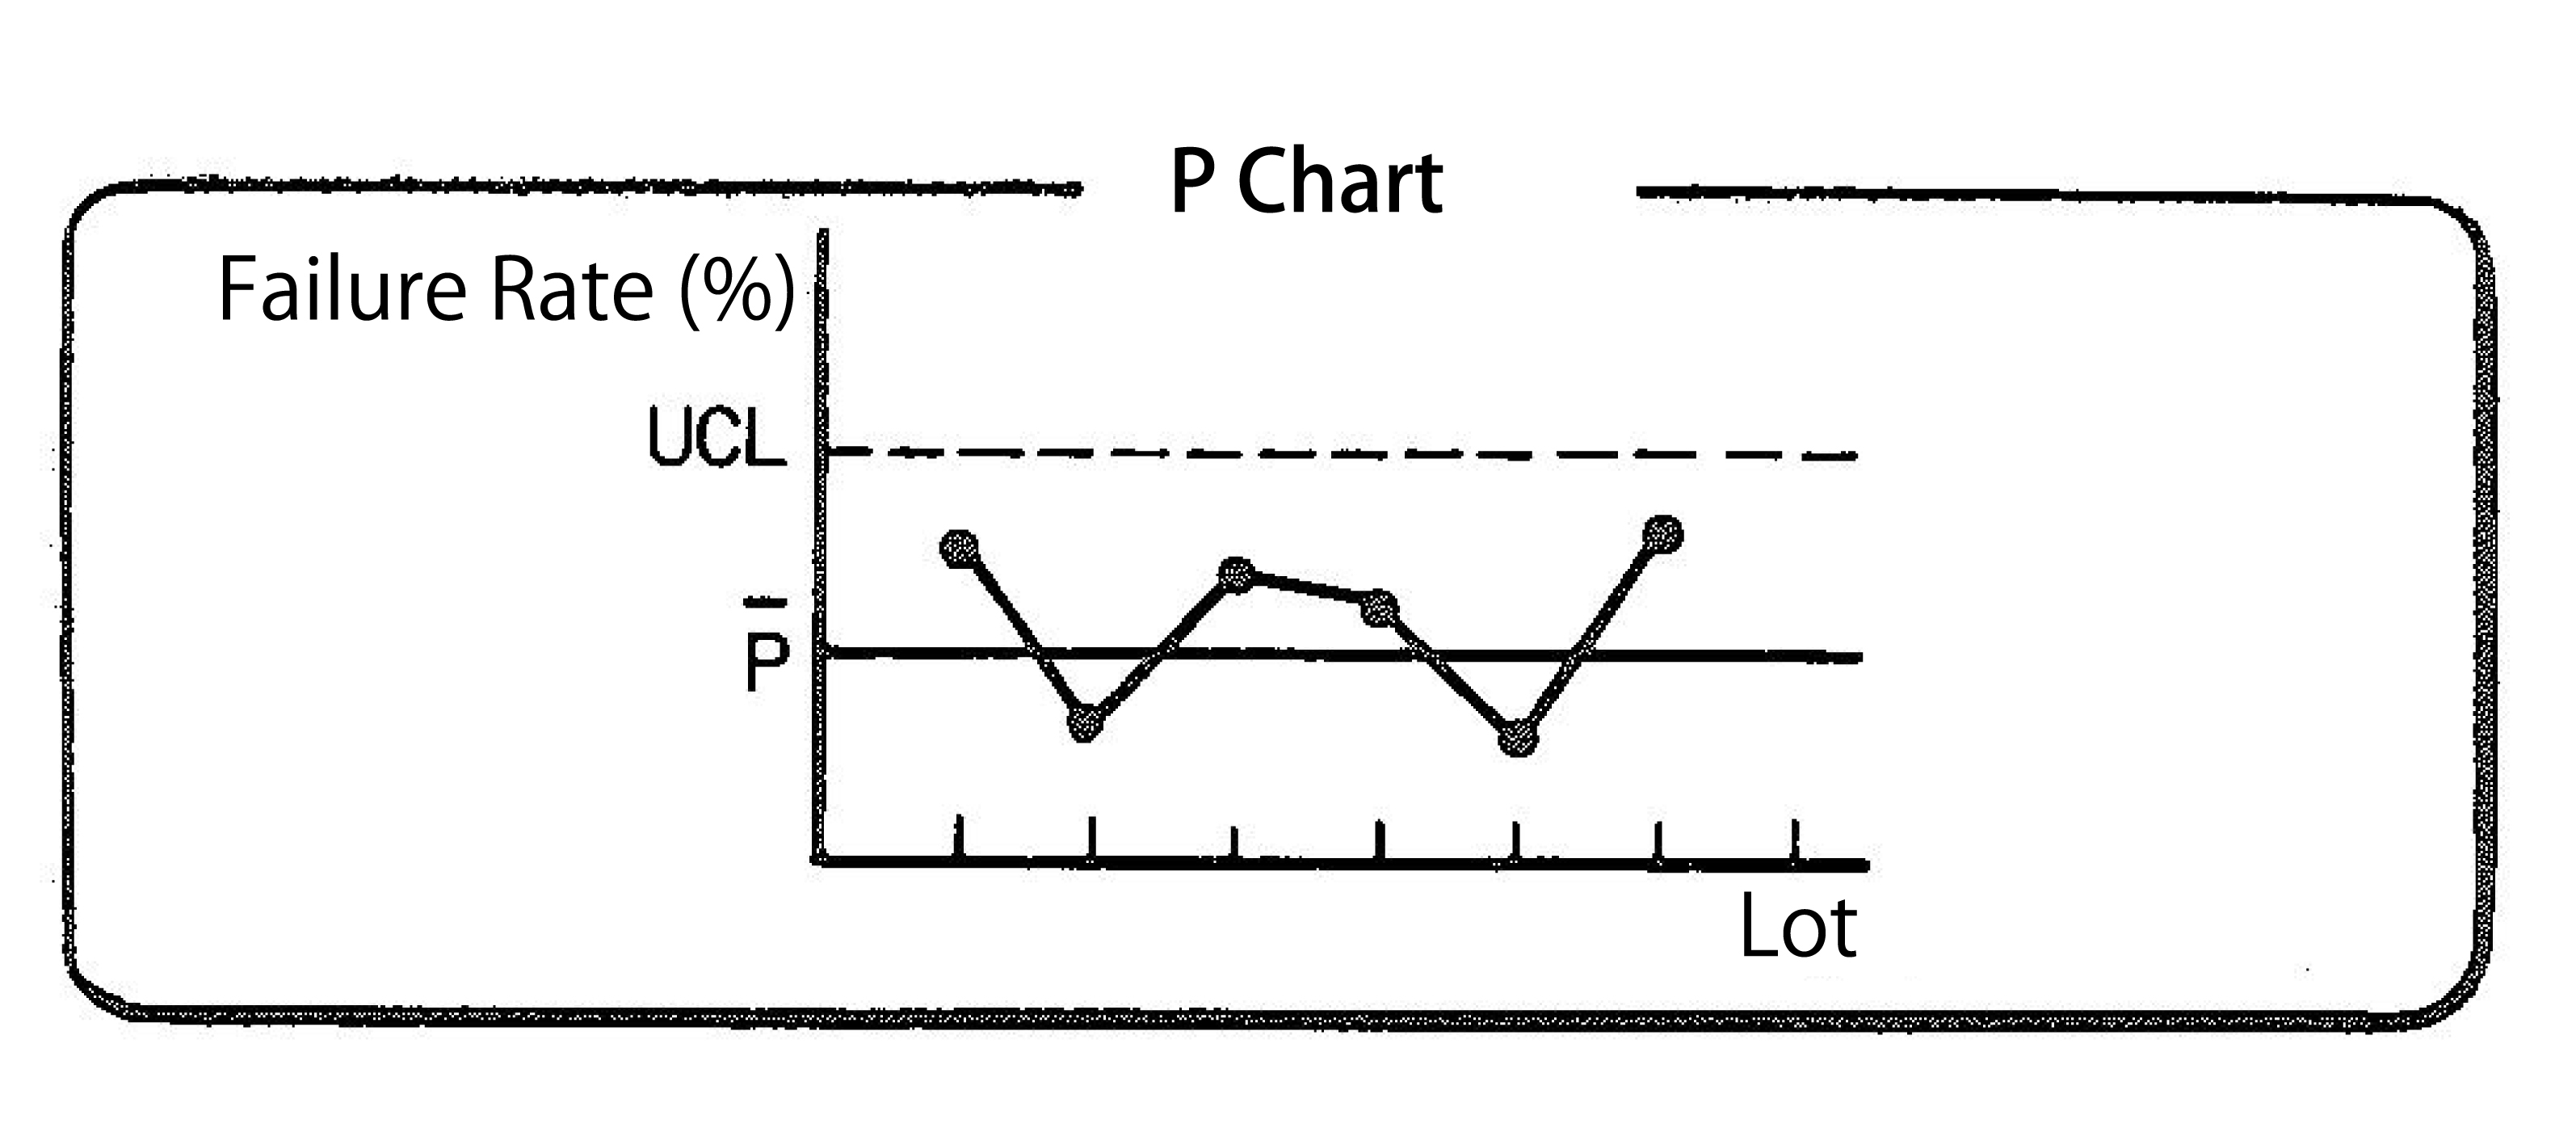
Related term: Control Chart
Reference:JIT Business Research Mr. Hirano Hiroyuki