MRP glossary TOP > X > x-R Chart
x-R Chart
x-R Chart
An x-R Chart is used when the quality characteristic values the process controls include length, weight, hours, electrical resistance, tension strength, degree of purity. An x Chart is used to control the change in average value, while an R Chart is used to control the change in variability. An x-R Chart is drawn by the following procedure:


Related term: Control Chart
An x-R Chart is used when the quality characteristic values the process controls include length, weight, hours, electrical resistance, tension strength, degree of purity. An x Chart is used to control the change in average value, while an R Chart is used to control the change in variability. An x-R Chart is drawn by the following procedure:
- 1) Select data:
- create an inspection lot (k), select 4 or 5 samples (n) from each lot, and measure the quality characteristic value
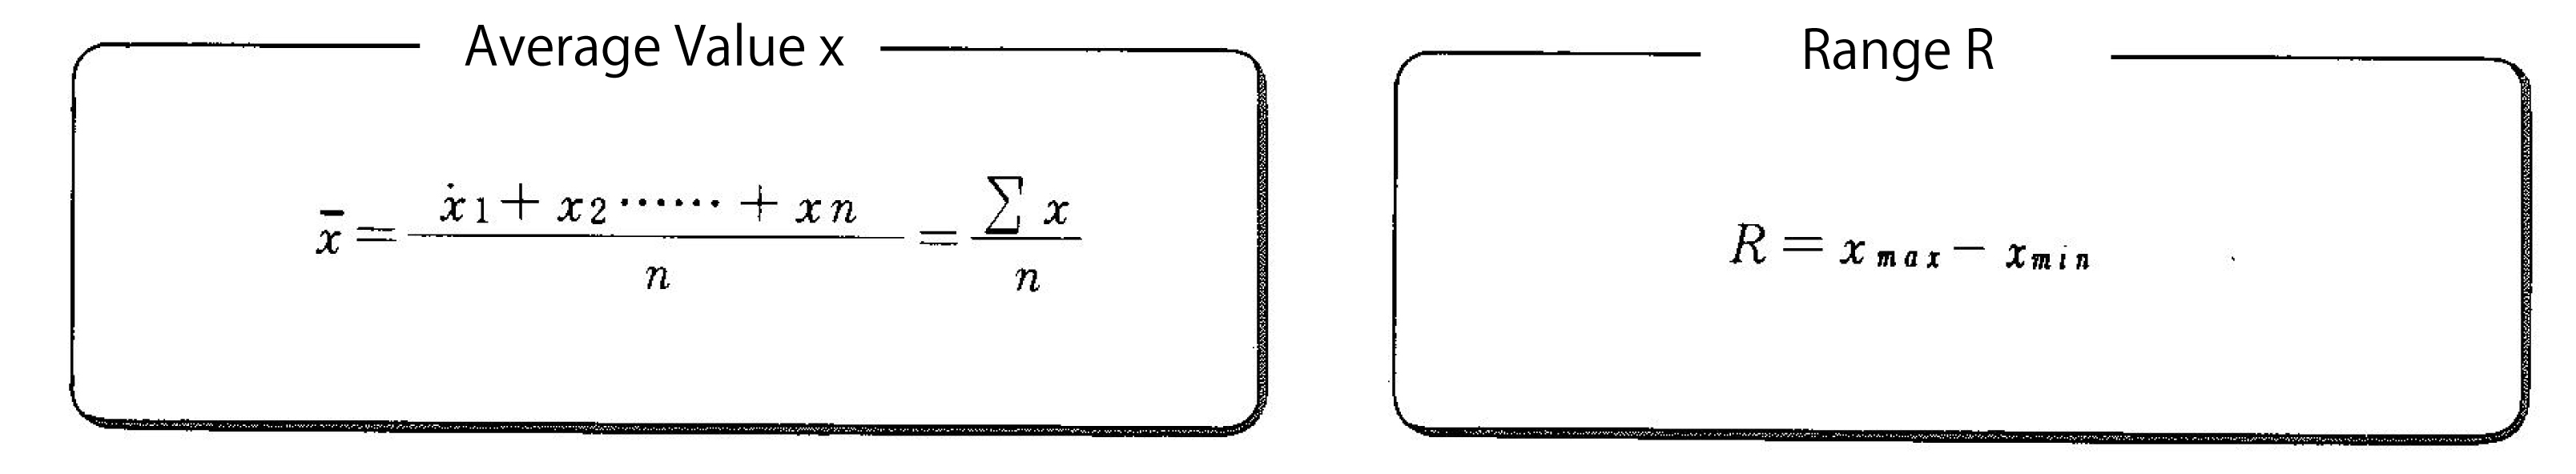
- 2) Calculate average value x, and range R:
- calculate the average value x, and range R of each log
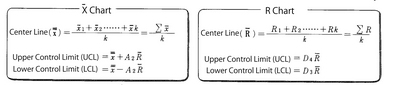
- 3) Calculate control limit:
- calculate control limit including center line (CL), upper control limit (UCL), lower control limit (LCL) by using the control limit factor of x-R Chart

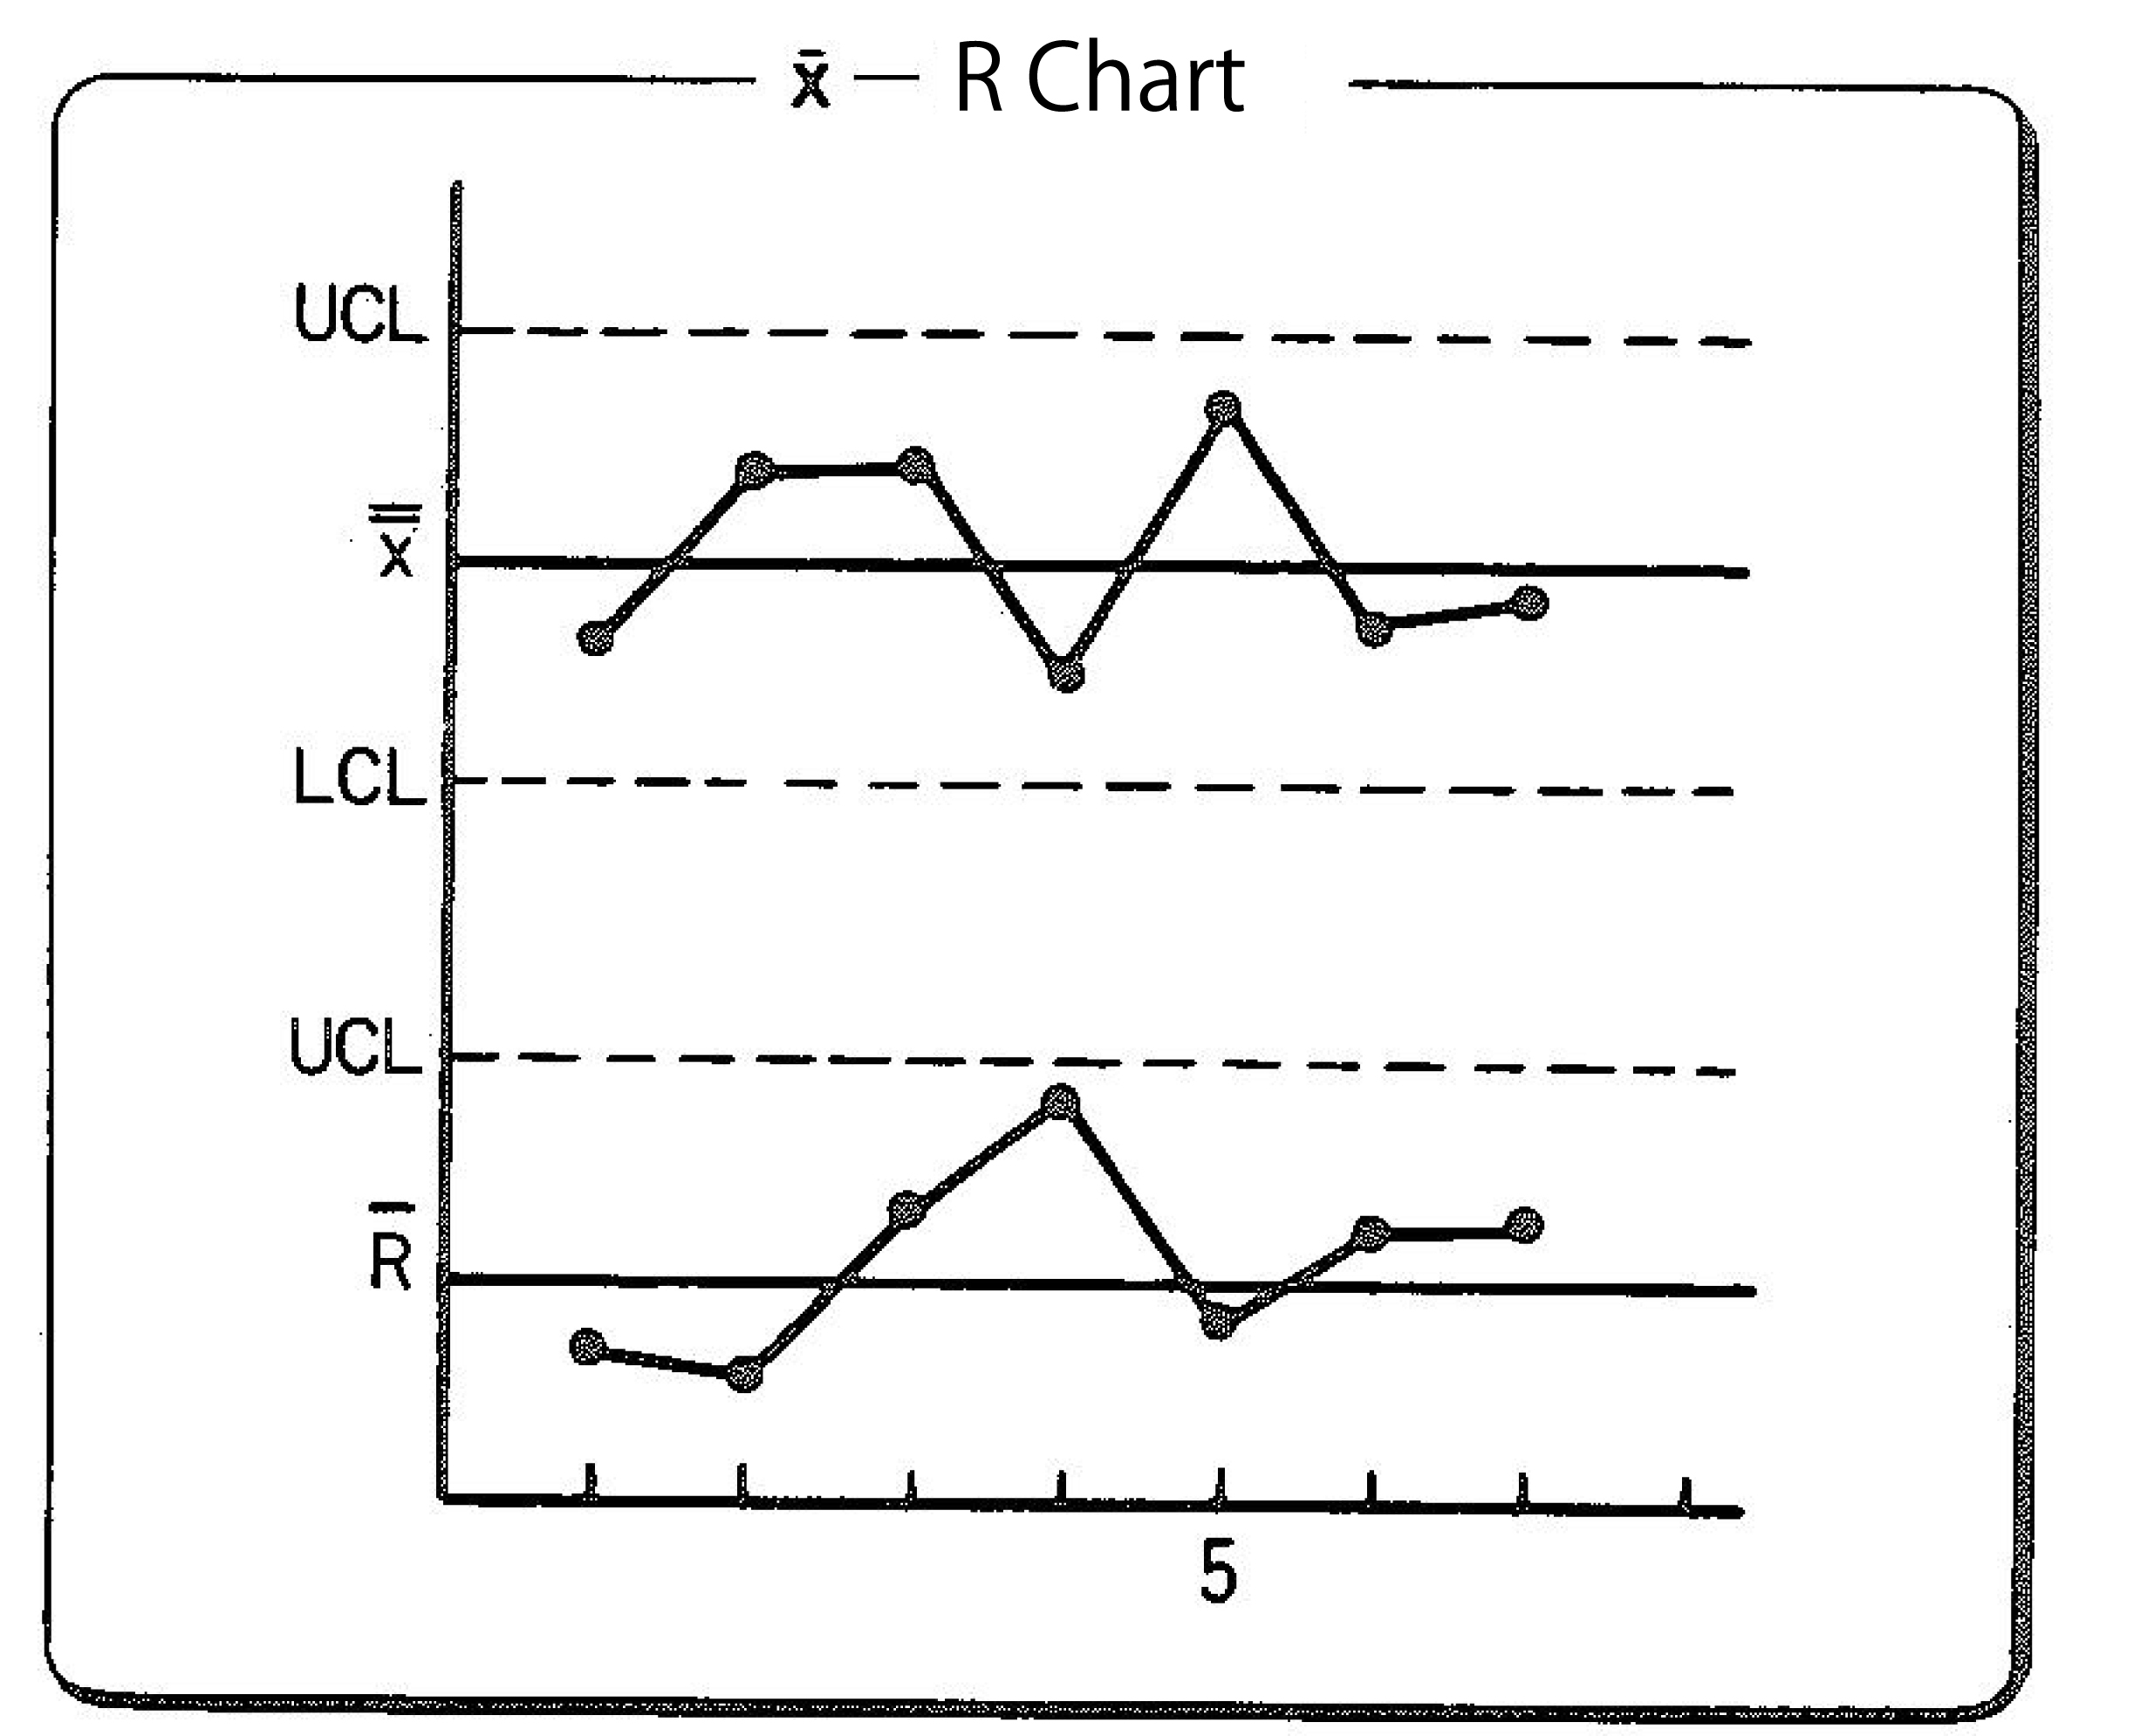
- 4) Utilize the x-R Chart:
- when all points of each lot are within the control limit line, the manufacturing process is thought to maintain in the state of statistical control, while when any point is out of the control limit line, some failure is determined to occur, and so the cause should be examined and some measures should be taken. Since all the cases when any point is out of the control limit in x Control Chart, a sequence whose length is over seven appears, seven consecutive points are all going up or all going down, and etc. are assumed to be a failure, the way of working should be changed and the tools and machines should be changed because they might be worn down. The R Chart with a point over the upper limit shows larger variability, and thus it is critical to identify the cause immediately and take measures to try to prevent the same failure again in the future.
Related term: Control Chart
Reference:JIT Business Research Mr. Hirano Hiroyuki
X Chart | X | x~-R Chart